Learn how to populate some slides in your presentation as a user of Present Pro. This example end-to-end process adds visuals and slicers to a new presentation and explores how you can professionalize your data layout using design tools such as guidelines in the fixed layout.
Note: This content guides you through the simplest end-to-end version of creating and saving a presentation to get you familiar with the overall process. For more detailed guidance on each of the processes that you might follow when building your presentation, see Building a Presentation using Present Pro.
Before you begin
This walkthrough assumes that you are a Present Pro user. If Present Lite opens, then you should follow the Present Lite walkthrough instead.
- Click here for the Present Lite walkthrough
End-to-end process
Step 1: Create a new presentation
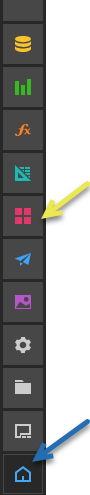
From the App Toolbox on the Pyramid home page:
- Click New Presentation (yellow arrow).
- To create a presentation with the default settings, just click Create in the bottom corner of the page.
The New Presentation launcher opens.
A new presentation is created with the default theme, device, layout, and size.
Note: Selecting the default "fixed" layout means that the presentation will be created with a grid in the background, which you can toggle on and off. This grid allows you to drop your content items (visuals, slicers, and so on) onto the canvas anywhere and optionally snap them to the grid. This is unlike the "tiled" layout where content items can only be placed along the tile lines.
More information
This step provided the simplest entry point that you can use to create a new presentation in Present Pro. If you want to learn more about this process and about the other options that you may select when creating a presentation, see the following topic:
- To learn more about building presentations, see Building a New Presentation in Present Pro
Step 2: Add a cover
The presentation that you just created uses the default theme selected in Step 1 to define the presentation's colors, fonts, styling for visuals and slicers, and even "master pages" (that add some common graphics, text, navigation options, and so on to all the slides in your presentation). This step is going to create a new front page or "cover" for this presentation; the cover will be styled according to the same theme and used to professionalize the presentation for your audience.
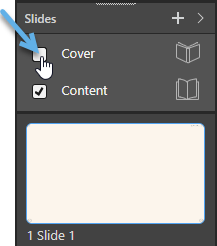
From the Slides panel:
- Select the Cover checkbox (blue arrow).
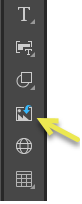
- Add a Corporate Logo to your cover:
- From the Toolbox, click the Import Image option (yellow arrow, below) and navigate to your image on your local machine.
- Optionally, move your image to an appropriate position on the canvas:
- Resize the image using the handles that are visible at its corners and edges when it is selected.
- Reposition the image by dragging it to a better position.
Your image is added to the canvas in a "selected" state.
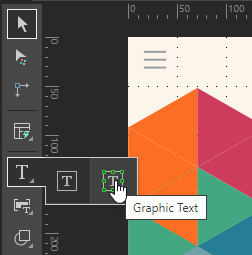
- Add a Title for your presentation:
- From the Toolbox, right-click Text > Graphic Text.
- Click the canvas at the point where you would like to add your company name.
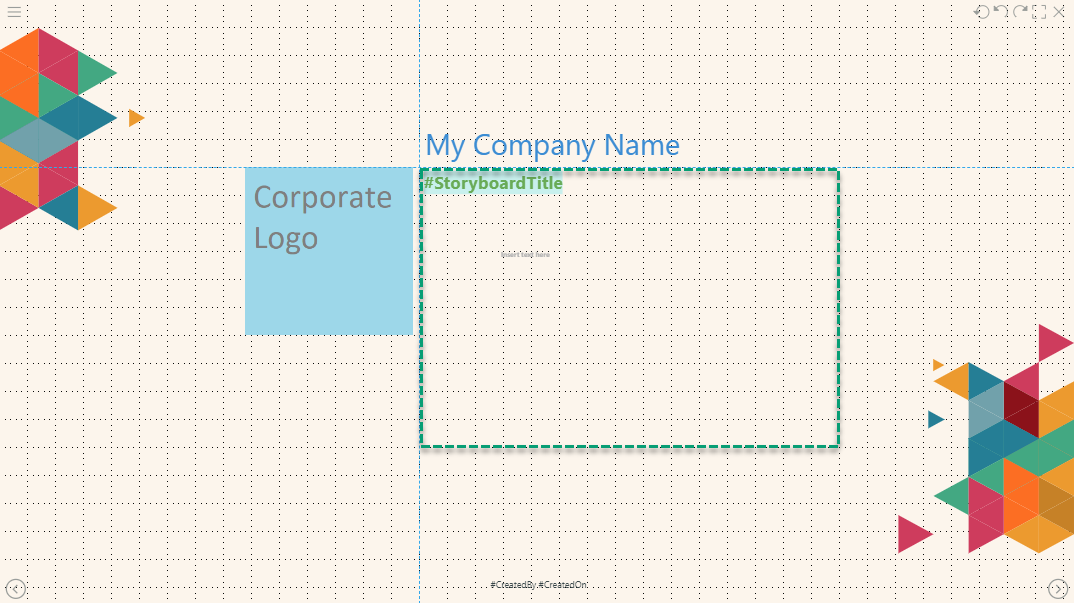
- Add your company name and resize and reposition the text field by grabbing its handles.
A text box is added to the page at the selected point.
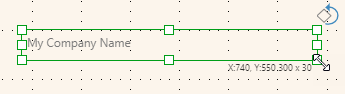
Since this is Graphic Text and not a standard text field, resizing the text box also resizes the text contained within the box.
If this option is available, Slide 1 in your presentation is updated to use the Master associated with a Cover. Most presentation covers include some additional background images and layout details that make it different to any of the other slides in the presentation.
Your basic cover is created. You might want to add extra content here, such as a copyright notice or the names of authors, a publication date (perhaps using variable text fields, so these are variable values), and so on.
More information
The purpose of this step was to demonstrate that you can change some options in Present Pro to create a cover, to add some styled text, and to add an image. There are lots of other styling and formatting options, including changing the theme that controls the colors and updating the masters that affect formatting across your presentation. For more information about these options, see the following topic:
- To learn more about covers, themes, and styling, see Formatting in Present Pro
Tip: As well as applying your master to your presentation, you may also want to edit the master's content (for example, to add an image to every page of this presentation). For more information, see Master Pages in Present Pro.
Step 3: Enable layout tools (optional)
There are several layout tools in Present Pro that help you to build perfect presentations without having to deal with lots of design complexity. This step is going to set up some vertical and horizontal "guidelines" to help you to control the arrangement of items on your slides, managing where they are positioned relative to one another so that you can view the finished presentation as a slide show without the visuals and text seeming to jump about from slide to slide.
Note: This step is only relevant where your presentation has a fixed layout. If your presentation has a tiled layout, you can use the tiles to position your visuals and text accurately on each slide.
- If you navigated away, you need to click on Slide 1 in the Slides panel to return to the first slide.
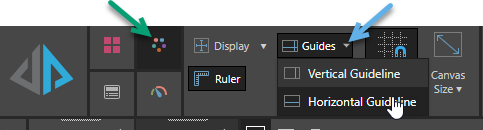
- Go to the Design ribbon and open the Guides dropdown menu, selecting Guides > Horizontal Guideline.
- Drag the new horizontal guideline to 300 mm.
- Create a vertical guideline by selecting Guides > Vertical Guideline on the Design ribbon and dragging the vertical guideline to 750 mm.
Tip: You can rename Slide 1 using the right-click context menu options in the Slide panel, should you wish to.
A guideline is added to the canvas.
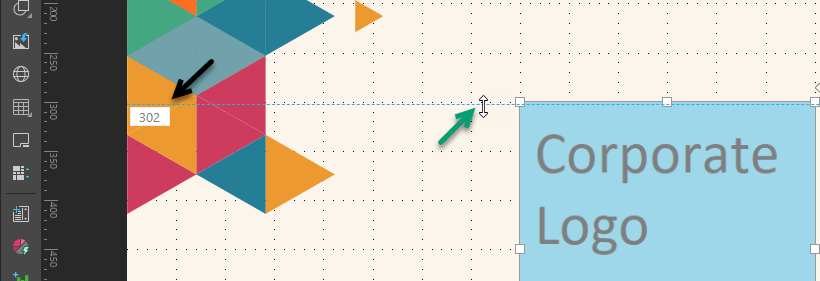
Note: Your cursor changes to a double-headed arrow when you are in the correct position over the guideline to reposition it (green arrow). There is also a pop-up telling you the current position of the guideline as you reposition it (black arrow).
The guidelines are added to your canvas. When you create new slides, you may need to "show" these same guidelines by clicking Guides in the Design ribbon. Having the same guides on every slide helps you to position your visuals in the same place on every slide (dashed green box):
Tip: When you use this functionality to create your own presentations, you might want to add more guidelines to your canvas; to indicate where other content items should be placed, or to give guidance about the size of the main visual.
More information
The purpose of this step was to demonstrate that there are tools in Present Pro that help you to achieve a professional look and feel. As well as guidelines, there are other options that allow you to snap to grid, show or hide rulers, and align or distribute the content items that you add to your slides. For more information about these options, see the following topic:
- To learn more about the layout tools, including guides, see Layout Tools in Present Pro
Step 4: Add a one-off visual
Now that you have created your cover and added your guidelines, you can add a new slide and place a new visual on that slide.
Important: This is probably the most important stage of creating your presentation. You will add some analytic content that you want to share with your audience. In this case, creating a one-off visual that only exists within this presentation and cannot be reused by other users or in other presentations using Smart Reporting. You could, instead, add shared visuals from the content manager, infographics, dynamic web panels, and so on. For more information about these alternative options, see Adding Content Items in Present Pro.
- Add a second slide to your presentation, by selecting New Slide on the Presentation ribbon.
- Create a visual that shows a measure (Sales) by a hierarchy type (Product Category):
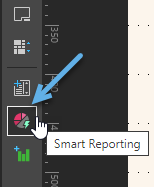
- From the Toolbox, click Smart Reporting.
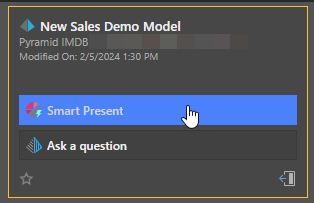
- In the Smart Reporting page, navigate to the demo model and select the Smart Present option:
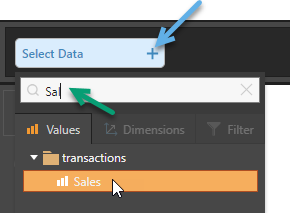
- For each of the measures, dimensions, or filters that you want to add to your visual:
- Click the Select Data + button (blue arrow) to open the data selection panel.
- Click the relevant tab to specify whether you want to select a measure (Values), a dimension, or a filter.
- Either use the search field to filter the options by name or navigate through the tree to your option.
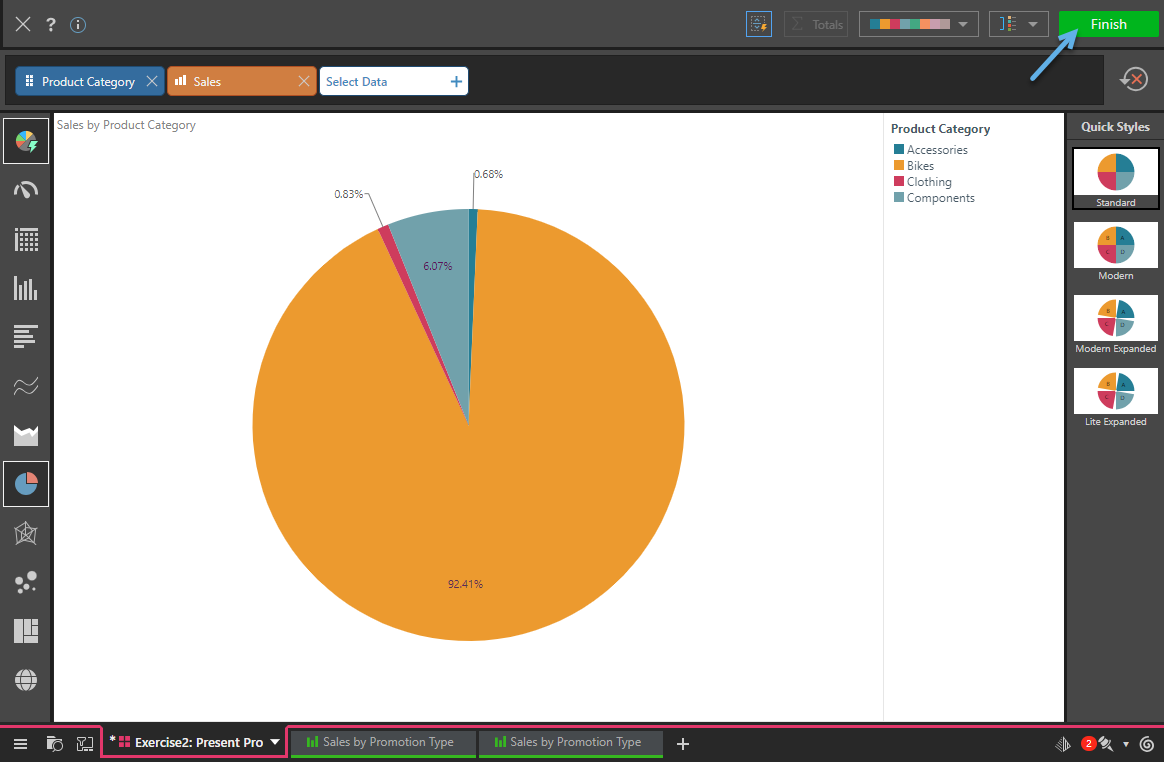
- Click Finish (top-right) to save your changes and drop your new visual into your presentation.
- Optionally, click Guides on the Design ribbon to show the guidelines on your slide, and then drag and drop your new visual to the correct position according to those guidelines.

Note: The new slide has a very different appearance to the first slide you added, because it is a content page and not a cover page. Your presentation can only have one cover page.
Note: You can only select filter or dimension after you have added at least one measure.
Each option you select updates the visual, including selecting the most appropriate visualization type given your selections.
It is important to note that your new visual only exists inside this presentation. If you want to share it with other users, you need to use the Make Shareable option on the right-click context menu to save it in the content management system.
If you followed the preceding steps to create a visual containing a Sales measure and Product Category dimension, Smart Reporting will have built a simple Pie Chart:
More information
The purpose of this step was to demonstrate adding some analytic content to your slide for your reader. There are lots of different types of content items that you can add to your slides, from visuals to slicers, and dynamic images to text. For more information about these options, see the following topic:
- To learn more about creating and adding visuals, see Adding Content Items in Present Pro
Step 5: Add a slicer
Now that you have created a new visual, you should create a slicer that allows you to interact with the visual by selecting an option that filters its content. Since the pie created in the last step showed sales by product category, a useful slicer might allow us to see whether there were any promotions that strongly affected the sales.
- From the Toolbox, click the New Slicer option.
- Select the Model and Data that you want to use.
- From the Presentation ribbon, click Show Interactions to show the interaction between your slicer and your visual, and then click it again to hide the interaction.
- Set your slicer to default to disabled:
- Right-click your slicer on the canvas and select Slicer Settings from its context menu.
- Select Other Settings and in the Other Settings panel select the Disable checkbox.
- Click Apply to save your changes and close the panel.
The Slicer Settings panel opens at the bottom of the page.
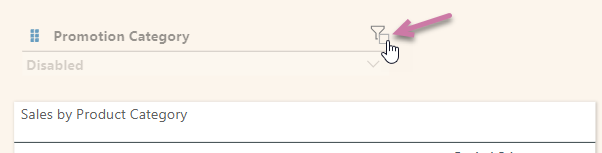
- Click F2 to run your presentation and check that you can Enable and Disable the slicer (purple arrow) and select different options from the slicer to filter the visual.
The New Slicer panel opens.
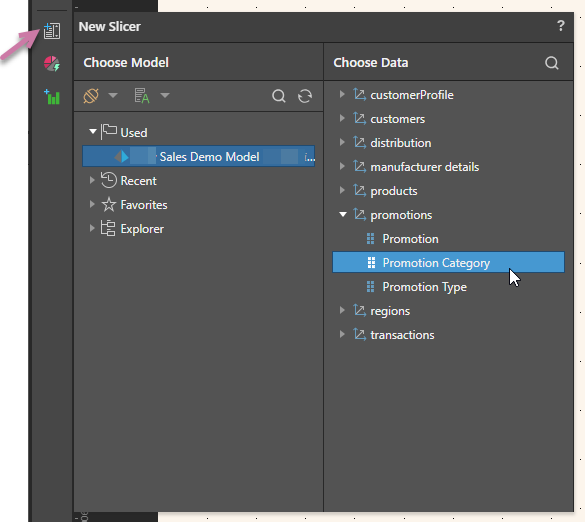
This example shows that the model used in this presentation is selected and the slicer will include the content of the Promotion category. The Slicer is added to your canvas.
This arrow indicates that changes to your slicer will affect the content of your pie chart, cross-filtering its content in response to your changes.
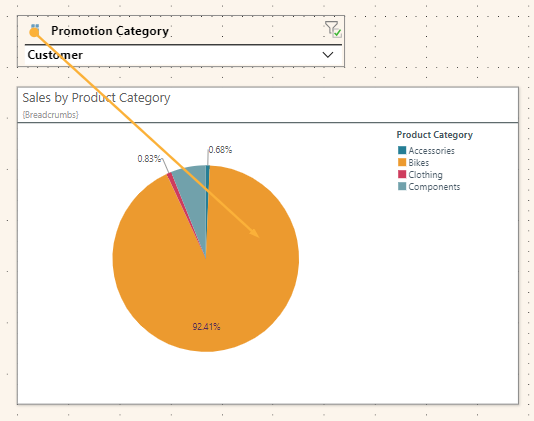
This type of interaction is typically added automatically (Auto Interact) but if you do not see an interaction, you should create one. For more information, see Interaction Picker.
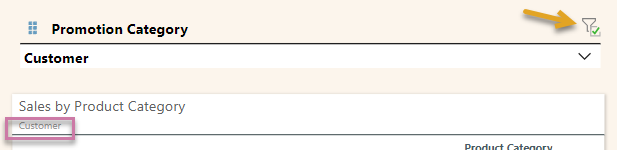
You should note that, when you select options from the Promotion Category slicer, the whole content of the visual is filtered accordingly. By default, this includes a bookmark value on the subtitle that indicates the slicer selection (purple highlight):
More information
The purpose of this step was to demonstrate adding, configuring, and using a very simple slicer on your presentation. There are lots of different types of slicers that you can add (dropdown lists, buttons, multi-select options, and so on), and there is lots of flexibility in how you can configure those slicers. For more information about these options, see the following topic:
- To learn more about creating and adding slicers, see Managing Slicers in Present Pro
Step 6: Review and modify the slides
Once created, you can modify the content of the presentation, by:
- Adding, removing, or adjusting content items, such as text fields, existing visuals or visual areas, and so on, to suit your requirements: Adding Content Items in Present Pro.
- Formatting and applying design features to your slides or overall presentation: Formatting in Present Pro.
As you edit your presentation, you should regularly view your changes "at runtime." You can open the runtime view by clicking Run (top-left) or pressing F2 on your keyboard:
Step 7: Save the presentation
Save your presentation in My Content:

This saves your presentation locally.
More information
This step describes how to save your presentation locally. If you want other members of your team to be able to use or edit your presentation, and you have sufficient access rights to do so, you should save it to your workspace or public folders. For more information, see:
- To learn more about saving presentations, see Saving and sharing presentations
Alternative processes
To learn how to build a presentation either using AI or in the Present Lite app: